source("scripts/chap1.R")3 Data
3.1 Integrating your R data workflow into this thesis template
- You will have R/Python data analysis scripts which do various things to raw data from your thesis.
- You may want to contain this all within the thesis repository to keep everything neat
- You could do something like I have done below in Section 3.1.1
- Or you could do your analysis directly in the chapter .qmd files. But probably that would make your .qmd files quite long and unpleasant!
3.1.1 R code
Remember when you source things from within your chapters/.qmd files the current working directory is in the chapters directory. Therefore define the filepath relative to there. Refer to the table and figure in text with Table 3.1 and Figure 3.1.
plot_temp_ozone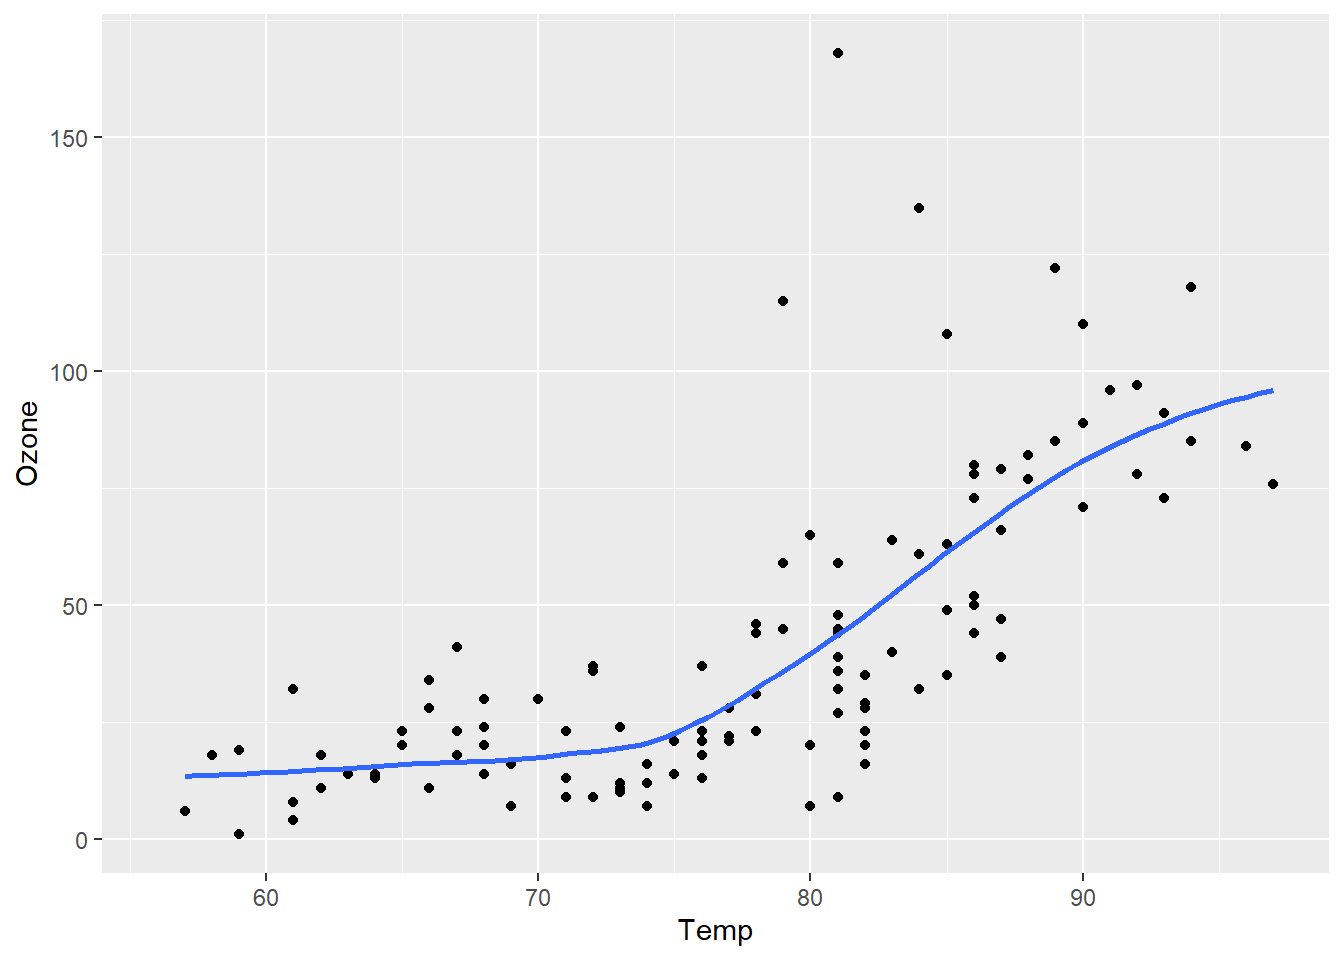
summary_table| Summary of Temperature and Ozone | |||
|---|---|---|---|
| Descriptive statistics of air quality data | |||
| Mean Temperature (°F) | SD Temperature (°F) | Mean Ozone (ppb) | SD Ozone (ppb) |
| 77.9 | 9.5 | 42.1 | 33.0 |
I have put this table in an appendix to show how that would work. Please see Appendix A Table 1.
3.2 Example of Quarto Callout Blocks
Quarto allows us to add various types of callouts to emphasize key information in our documents.
3.2.1 Callout Examples
Note
Note that there are five types of callouts, including: note, warning, important, tip, and caution.
Tip with Title
This is an example of a callout with a title.
Expand To Learn About Collapse
This is an example of a ‘folded’ caution callout that can be expanded by the user. You can use collapse="true" to collapse it by default or collapse="false" to make a collapsible callout that is expanded by default.
Tip with Title
This is a callout with a title.
Pay Attention
Using callouts is an effective way to highlight content that your reader give special consideration or attention.